- 9,249 Applied
- 4,019 Admitted
- 465 Enrolled
CLASS OF 2029 PROFILE
APPLICATIONS
ADMIT RATE
- 43% overall admit rate
- 30% of incoming students were admitted through Early Decision I and II
ACADEMIC PROFILE
- Students in the top 20% of their high school class (where ranks were reported): 76%
- Average GPA on a 100 point scale: 90
- Middle 50% Ranges for SAT and ACT
- SAT:
- Applicants: 1360 - 1500
- Admitted Students: 1370 - 1500
- Enrolled Students: 1320 - 1460
- ACT:
- Applicants: 31 - 34
- Admitted Students: 31 - 34
- Enrolled Students: 30 - 34
- Testing optional data:
- 57% of applicants did not submit standardized testing.
- 50% of admitted students did not submit standardized testing.
- 67% of enrolled students did not submit standardized testing.
- SAT:
- Top 15 intended areas of study:
- Engineering, Economics, Psychology, Liberal Arts (Undecided), Biological Sciences, Pre Med/Pre-Health, Political Science, Biochemistry, Computer Science, Environmental Science, Neuroscience, Mathematics, Physics, Pre-Law, English
DEMOGRAPHIC DISTRIBUTION
- Gender:
- 56% Male
- 44% Female
- <1% Non-binary/Gender non-conforming
- First-generation students: 23%
- Breakdown by race/ethnicity (by IPEDS classification):
- Asian: 7%
- Black or African American: 11%
- Hispanic of any race: 14%
- Two or more Races: 6%
- White/Unknown: 56%
- International: 6% (non-U.S. citizen/permanent resident)
- High School Education:
- Public and/or Charter Schools: 64%
- Independent, Private, or Religious Schools: 35%
- Homeschooled: <1%
- Community Based Organizations (CBOs) represented: A Better Chance (ABC), ASP Dallas, AVID, Breakthrough, Double Discovery Center at Columbia University (DDC), East Harlem Tutorial Program, EMERGE, Gear Up, Heckscher Scholars Program, KIPP, La Vida Scholars, Latino U College Access, Let's Get Ready, Matriculate, One Goal, POSSE, Prep for Prep, QuestBridge, RAW Art Works, Service to School, The Academy Group, The TEAK Fellowship, TRIO, uAspire, Yonkers Partners in Education, Youth Development Organization (YDO)
FINANCIAL AID
We meet the full demonstrated financial need of admitted students who submit all financial aid materials by published deadlines. In order to meet this commitment, we are need aware in the admissions process. This means that if you are admitted to Union, the College will work to bridge the gap between the cost of attendance and what your family is expected to contribute, ensuring that a Union education is accessible, regardless of your financial background. Our financial aid office offers two calculators to get started on an estimate.
- Average merit award for the incoming class: $33,800
- Percentage of the incoming class receiving Pell grants: 27%
GEOGRAPHIC DISTRIBUTION
- 32 U.S. states and territories and 19 countries represented
- 38% New England
- 30% New York State
- 12% Middle Atlantic
- 2% Midwest
- 2% West Coast
- 7% Remaining U.S. (South & Southwest)
- 7% International
- Top 10 states are NY, MA, CT, NJ, PA, (NH, TX tied), VA, CA, (IL, NC, RI tied)
Updated 10/02/2025

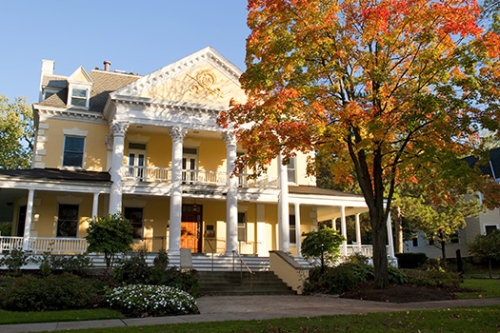
Grant Hall
Admissions
Grant Hall (Admissions)
807 Union St.
Schenectady, NY 12308
Office Hours
Mon - Fri: 8:30 a.m. - 4:30 p.m.

